1-Piping Design Basics: A Beginner’s Guide with Clear pricing Chart Explanations
If you are new to the world of pipes, pipe charts can seem confusing. However, having a good understanding of these tools is essential for anyone working with pipeline systems. This beginner’s guide will explain what pipe schedules and pipe charts show, and how to read them.
Defining the Piping design and rate Chart
l What is a Rate chart?
A rate chart refers to the system used for standardizing the dimensions, pressure capacities and materials of manufactured pipes. It allows pipes to be produced and purchased according to a standardized system instead of custom specifications every time. A rate chart is a detailed listing that defines the piping design, physical dimensions and wall thickness of pipes. Historically, these charts have been central to the planning and execution of projects that involve piping designs and systems.
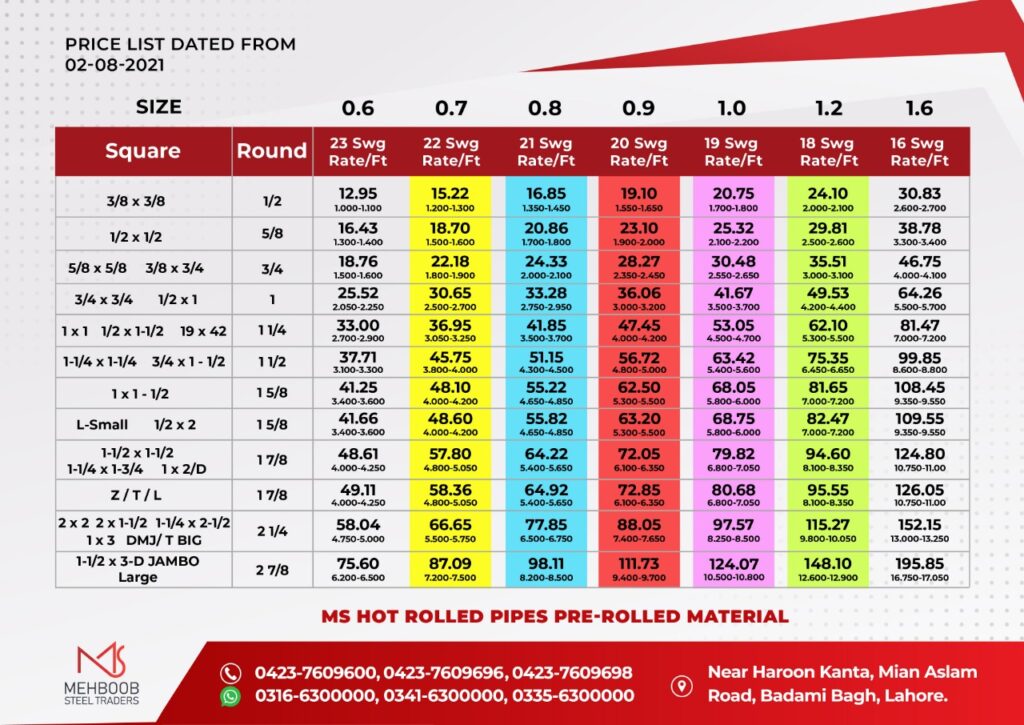
These rate charts are denoted with a number – for example Swg 22 or Swg 23. The Standard Wire Gauge indicates the diameter of the metal rods or thickness of the sheet. The higher the gauge, the smaller is the diameter. The gauge of the metal pipes comes in various ranges on the basis of their application.
l What Does a Pipe Chart Show?
A pipe chart displays information about piping design and of different materials a. Some key information included on pipe charts is:
- Nominal pipe size – The approximate inside diameter of the pipe. Common sizes include 1/2 inch, 3/4 inch, 1 inch etc.
- Outside Diameter – The external pipe diameter.
- Wall thickness – The thickness of the pipe walls for a given schedule.
- Weight per foot – The weight per linear foot of pipe.
Charts allow you to look up dimensions, wall thicknesses and weights for schedule 40, 80 and 120 pipes of various materials and pipe sizes. This information is essential for design and purchasing decisions. The customers are willing to buy steel piping design based on their need according to their standard wire gauge.
The Anatomy of a Piping design and rate Chart
Identifying the Elements
Each rate chart includes critical information such as pipe size, wall thickness, and diameter. Understanding these elements is key to choosing the right pipe for your project.
How to Read a rate Chart
Piping design and rate charts can look complex at first, but are easy to understand with some basic knowledge:
- Identify the piping design material – Steel, stainless steel, copper etc. Materials have different properties.
- Locate the pipe size – The nominal size in inches – along the left side or top of the chart.
- Look up the wall thickness and other dimensions for that size pipe under the desired schedule. Higher schedules have thicker walls and can withstand higher pressures.
- To find the weight per foot, trace down from the pipe size and over to the weight column in the schedule you need.
With some practice reading different pipe charts for various materials, you will get the information of locating the specifications you need. Following is a rate chart for Hot Rolled (HR) pipes and shows the size, diameter and shape for different varieties of pipes. The piping design and dimensions are essential to know before buying material for construction because these pipes found application in different industries. The following pipe schedule chart issued by Mehboob Steel Traders shows the rate per feet for different sizes of square and round pipes.

Practical Applications:
Where Does a rate Chart Come into Play?
From small-scale plumbing tasks to large industrial projects, the pipe rate chart is an indispensable tool. Let’s explore some of the common applications of these charts
Mastering the Chart
l Best Practices for Using a rate Chart
Understanding the piping design and using the rate chart effectively requires understanding best practices and common pitfalls. This section will offer tips to make the most out of these charts.
l Know the Application
Determine the piping design and what the pipeline will be used for – water, gas, chemicals, etc. Also understand the operating temperatures and pressures expected. These factors determine what material and pipe design is suitable. Using an inappropriate choice can lead to leaks or ruptures.
l Allow for Pressure Surges
When sizing pipes, remember that actual pressures may spike above normal operating pressures at times. To allow a safety margin, consider going for the next higher standard size. A pipe schedule designed for just the normal pressure could be at risk for damage from pressure surges.
l Size for Flow Velocity
Flow velocity in the pipe should fall within optimum ranges. Excessive flow velocity causes erosion and noise while very slow velocities allow sediment to accumulate. Refer to industry guidelines for maximum and minimum velocities for the liquid or gas being handled. Size the diameter to stay within velocity limits.
l Calculate Pressure Drops
As pipe length increases, frictional losses lead to pressure drops along the pipeline. Make sure your pipe diameters and schedules limit pressure drops to acceptable levels for proper system operation.
l Leave Room for Insulation
If pipes need to be insulated, account for insulation thickness when reading dimensions off the chart.
l Use Actual Outer Diameter
The nominal size on charts and fittings (eg: 1 inch pipe) differs slightly from the real outer diameters. To achieve leak-free joints, use the actual outer diameters listed on the chart for sizing.

Conclusion
Piping design and sizing charts help standardize pipes and fittings for the pipeline industry. By following the above guide, you now understand key terminology, how to read charts to identify pipe specifications, and use them to select appropriate pipe swg for projects. With this knowledge, complex pipe charts will make much more sense. By understanding the art of reading and applying the information from a pipe schedule chart, you position yourself to make informed decisions, avoid costly mistakes, and enhance your professional competency. Remember, every great project starts with the right plan and the correct measurements, and the pipe schedule chart is your gateway to achieving this precision.
FAQs
Q1: What is the primary purpose of a pipe rate chart?
The primary purpose of a rate chart is to provide detailed information about the size and thickness of pipes. This information is crucial for ensuring that the right pipe is chosen for a specific application, guaranteeing safety and efficiency.
Q2: Is the rate chart universal for all types of pipes?
While rate charts are widely used across various industries, the specifications might vary depending on the material and type of pipe. It’s important to refer to the correct chart for the specific type of pipe you are working with. They have different dimensions based on their application.
Q3: How important is wall thickness in a pipe rate chart?
Wall thickness is a critical aspect of a chart. It determines the strength and durability of the pipe, especially in applications where the pipe needs to withstand high pressure or extreme conditions.
Q4: Can a beginner easily understand piping design and rate chart?
Yes, with the right guidance and practice, beginners can understand and effectively use a pipe schedule chart. It’s all about familiarizing oneself with the chart’s layout and the significance of the various measurements.
Q5: Are there digital tools or apps to help understand rate charts?
Absolutely! There are various digital tools and apps available that can help simplify and explain rate charts. These tools are particularly useful for visual learners and can be a great supplement to traditional learning methods.


Post a comment